
.png)
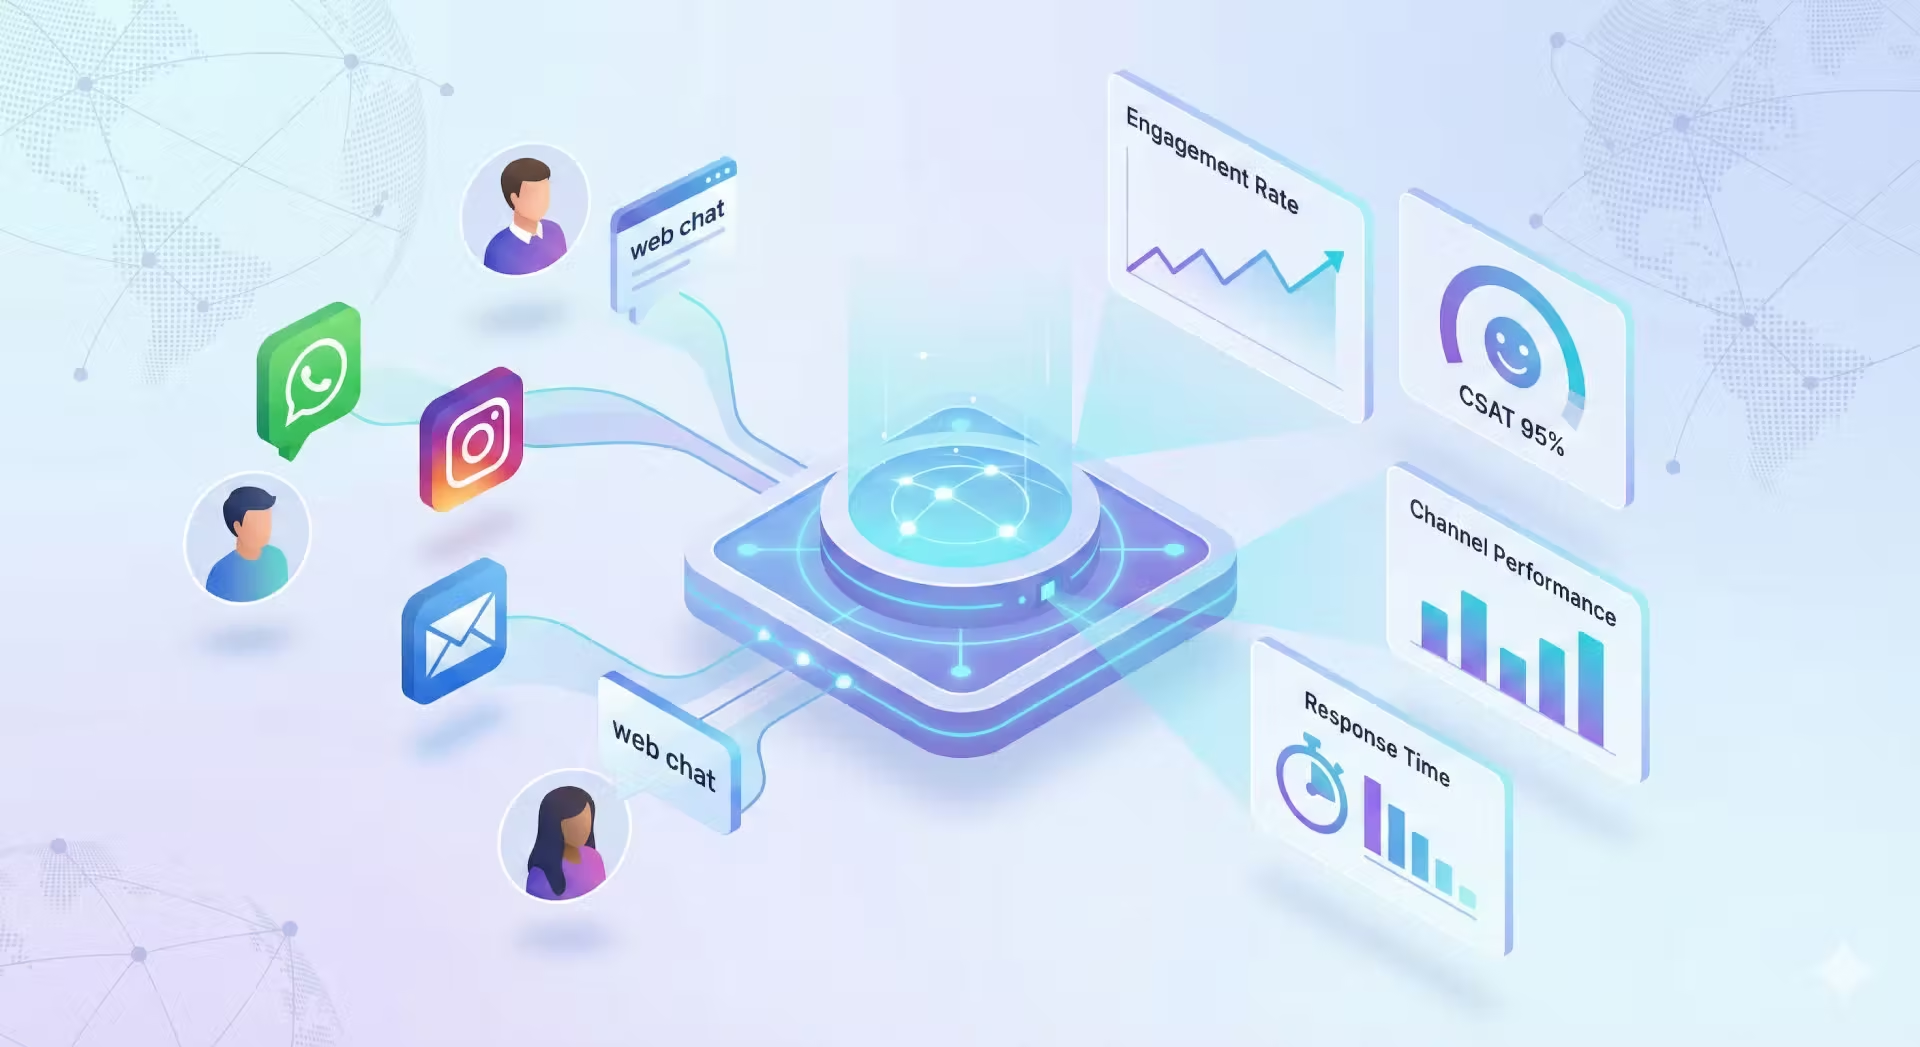
Your customers are interacting with your brand right now. They're sending messages on WhatsApp, commenting on Instagram, opening support tickets, and browsing your website. But here's the question that keeps you up at night: are these interactions actually meaningful?
In 2026, startups in e-commerce and SaaS pop up daily, yet many vanish quickly. If your business guesses what customers want, you could be heading for trouble.
You need hard data. You need customer engagement metrics that tell you exactly what's working, what's falling flat, and where your team should focus their energy.
The right metrics can change everything. They give you clarity. They help you spot problems before they escalate. They show you where to invest, where to improve, and how to keep customers coming back. And that's exactly what we're going to explore in this guide.
The metrics you track depend on your brand campaign, marketing channels, and 2026 goals. We’ve picked the essentials that work for most companies. We have covered the top 13 customer engagement metrics:
- Response Time
- Resolution Time
- Customer Satisfaction (CSAT)
- Customer Effort Score (CES)
- Net Promoter Score (NPS)
- Engagement Rate
- Repeat Interaction Rate
- Conversation Volume Trends
- Self-Service Engagement
- Channel Performance
- Team Performance
- Customer Retention Rate.
- Customer Lifetime Value (CLV)
Let's start with the basics, because understanding what these metrics actually are will shape how you use them.
What are customer engagement metrics?
Customer engagement metrics are measurements that show how actively customers interact with your brand across different touchpoints. They're not just vanity numbers that look pretty in a dashboard. They're practical indicators of customer behaviour, satisfaction, and loyalty.
Just as a doctor checks your heart rate, blood pressure, and temperature to understand your health, customer engagement metrics reveal the health of your customer relationships.
These metrics track things like:
- How quickly your team responds to customer queries
- How long does it take to resolve issues
- How satisfied customers feel after interactions
- How much effort do customers need to put in to get help
- How often do customers return to engage with your brand
- Which channels do customers prefer for different types of conversations
The keyword here is "actively". You're not measuring passive observers or one-time visitors. You're measuring genuine engagement from customers who interact with your brand, whether that's through messages, support requests, purchases, or social media activity.
For e-commerce and SaaS businesses especially, these metrics are goldmines of insight. They help you understand whether your support team is actually supporting people, whether your messaging channels are effective, and whether customers find it easy or frustrating to do business with you.
And perhaps most importantly, they give you something concrete to improve. You can't enhance "customer satisfaction" in the abstract. But you can reduce response times, streamline your resolution process, and make interactions smoother, all of which customer engagement metrics will reflect.
Why can’t you ignore customer engagement metrics?
Now that you know what customer engagement metrics are, let's talk about why they matter so much for your business. Because tracking metrics just for the sake of it is pointless. These numbers need to serve a purpose.
Understanding customer behaviour
Your customers are trying to tell you something through their actions, and engagement metrics help you listen to them. When you track how they interact with your brand, patterns start to show. Maybe WhatsApp users buy more often, quick replies boost satisfaction, or most questions come in between 2 pm and 4 pm. These insights show not just what customers do but why, so you can create experiences that actually match their needs.
Improving support quality
Think your support team is doing great? Metrics might tell a different story. Response times may be slower than you realised, or certain queries could be lowering satisfaction. With the right data, you know exactly where to improve, whether it’s adding staff, giving extra training, or updating your knowledge base.
Identifying bottlenecks
Every customer journey has bumps. Metrics show where things slow down, emails sit unanswered, or questions keep repeating. Once you know where the problem areas are, you can fix them with smoother workflows, better automation, and clearer self-service options.
Reducing churn
Customers who feel engaged stay longer and spend more. Those who feel ignored leave. Tracking engagement lets you spot warning signs early. If a once-active customer goes quiet or satisfaction drops, you can step in before it’s too late.
Increasing loyalty and revenue
Happy customers buy more, tell friends, and come back again and again. Improving engagement metrics helps you build loyalty, lower costs, and increase lifetime value. Small changes compound into bigger business results over time.
Making data-driven decisions
Metrics replace guesswork with facts. Thinking of adding a new support channel? Look at engagement. Considering hiring more staff? Check ticket volumes and response times. Metrics show you where to focus so your efforts have the biggest impact.
Best 13 customer engagement metrics to monitor in 2026
Let's get into the specific metrics you should be tracking. These aren't just theoretical concepts. They're practical measurements that directly impact your customer relationships and business success.
- Response time
Response time measures how long customers wait for your first reply. Quick responses show customers you value their time and take their concerns seriously, even if you can’t solve the problem immediately.
To track it, subtract the time a message was sent from when your team first responds. For live chat or messaging apps, aim for under five minutes. For email, a couple of hours is fine. Fast responses set the tone for a positive customer experience and make a huge difference in satisfaction.
- Resolution time
Resolution time tracks how long it takes to fully solve a customer’s issue. Customers care less about how fast you reply and more about how fast their problem is resolved. Measure it from when a conversation opens to when it’s marked as resolved.
Quick resolutions keep customers happy and your team efficient. Simple questions should be resolved in minutes; complex ones may take days. Aim to solve most issues in a single interaction and monitor first-contact resolution rates for insights.
- Customer satisfaction (CSAT)
CSAT shows how happy customers are with a specific interaction or experience. It gives direct feedback by asking them to rate satisfaction, usually on a 1-5 or 1-10 scale.
A high CSAT tells you customers feel heard and valued. To calculate, divide positive ratings by total responses. For e-commerce or SaaS, a score of 80% or higher is generally good. Track trends over time to identify what improves or hurts customer satisfaction.
- Customer effort score (CES)
CES measures how easy it was for customers to get their issue solved. Customers want convenience, not surprises or extra steps. High effort leads to frustration and churn, while low effort builds loyalty.
Survey customers with a simple question about how easy it was to resolve their problem, then calculate the percentage who rated it easy. Aim for 70% or higher and watch for spikes in effort, which show friction in your process.
- Net promoter score (NPS)
NPS gauges customer loyalty by asking how likely they are to recommend your business to others. Responses are grouped into Promoters, Passives, and Detractors, and the score is Promoters minus Detractors.
High NPS signals loyal customers who spread the word, while low scores warn of churn risk. NPS ranges from -100 to +100. Above 20 is good, above 50 excellent, and above 70 world-class. Track it to understand overall loyalty trends.
- Engagement rate
Engagement rate measures how many customers actively interact with your brand over a period. It shows whether your relationships are healthy or if customers are drifting away. High engagement signals customers find value in your business; low engagement is a warning.
Track it by dividing active customers by total customers and multiplying by 100. Use this metric to spot trends, segment behaviours, and plan re-engagement campaigns.
- Repeat interaction rate
This measures how often customers return to engage with your business. Repeat interactions indicate trust, ongoing interest, and higher retention. To calculate, find the percentage of customers with multiple interactions over a set period. Low rates may be normal for one-off purchases, while high rates show strong relationships, especially for subscription or service-based businesses. Track changes to spot disengagement early.
- Conversation volume trends
Conversation volume shows the total number of interactions across all channels over time. Spikes may indicate problems, campaigns, or seasonal demand. Drops could reflect successful self-service or declining engagement.
Track daily, weekly, or monthly totals and trends to forecast staffing, allocate resources, and measure the impact of changes like new features or knowledge base articles.
- Self-service engagement
Self-service engagement tracks how often customers solve issues on their own through FAQs, help centres, or automated tools. It reduces workload for your team and gives customers instant answers.
Measure it by tracking how many queries are handled without human help. A good rate is typically 30-50% of queries resolved through self-service. Continuously refine these tools to keep customers satisfied and reduce repetitive support requests.
- Channel performance
Channel performance compares metrics like response time, resolution time, and satisfaction across all communication channels like WhatsApp, Instagram, email, web chat, and phone. Not all channels perform equally.
Tracking performance helps you allocate resources, improve weaker channels, and promote the best ones. Look for channels with high volume but slow responses or channels that deliver great experiences but are underused. Use these insights to optimise customer support across all touchpoints.
- Team performance
Team performance metrics show how well your support staff handle customer interactions, including response times, resolution times, conversation volumes, and satisfaction scores. Tracking this helps you recognise top performers, identify who might need coaching, and ensure workloads are balanced.
The goal isn’t to blame anyone, but to improve support quality, empower your team, and make smarter, targeted improvements. Keep an eye on patterns and outliers to see where training or recognition is needed and where processes can be optimised.
- Customer retention rate
Customer retention rate measures the percentage of customers who keep coming back over a set period. It’s more cost-effective to retain existing customers than to constantly find new ones, and even small improvements in retention can boost revenue.
High retention means your customers find value and trust your brand, while low retention signals issues to address. Calculate it by dividing the number of original customers who stayed by your starting customer count, then multiplying by 100. Focus on improving your retention steadily rather than chasing generic benchmarks.
- Customer lifetime value (CLV)
Customer Lifetime Value, or CLV, shows how much revenue a customer brings over their entire time with your business. High CLV means loyal, repeat customers, while low CLV shows customers who leave quickly or spend little.
Knowing CLV helps you focus on keeping your best customers and making smarter business decisions. You can calculate it by multiplying the average purchase value, purchase frequency, and how long they stay with you. For subscriptions, multiply monthly revenue by customer lifespan. Aim for a CLV at least three times higher than your acquisition cost and work to grow it over time.

How does Trengo help you deliver a better experience for your customers?
With Trengo, your customers get support that feels personal, fast, and consistent, no matter how they reach out. Whether they send a message on WhatsApp, Instagram, Facebook, email, or web chat, everything is collected in one unified inbox, so they never have to repeat themselves.
Your team can respond quickly with AI-assisted reply suggestions, see the full conversation history, and handle routine queries instantly with automation. Customers experience faster resolutions, accurate answers, and proactive follow-ups that show you care before issues even escalate.
Trengo also makes it easy to track engagement and satisfaction across channels. Your team can spot trends, prioritise urgent messages, and provide tailored support based on past interactions and preferences. Customers feel recognised and valued, which builds trust, encourages loyalty, and increases repeat business.
With tools to measure response times, satisfaction scores, and team performance, you can continuously improve the experience and ensure every customer interaction contributes to stronger relationships and higher lifetime value. Basically, Trengo lets your business deliver customer-focused service at scale while keeping the human touch alive.
Final words
Customer engagement metrics show how well you connect with the people who matter most: your customers. Tracking these metrics gives you clear insights. You can see what works, spot issues early, make smarter decisions, and create better experiences.
Response time and resolution time show efficiency. CSAT, CES, and NPS reveal how customers feel. Engagement and repeat interaction rates show activity. Channel performance, team performance, retention, and CLV show how engagement drives results.
Trengo brings all your conversations into one inbox so you can monitor and improve every metric. Track response times across WhatsApp, Instagram, email, and chat.
See which channels perform best, measure satisfaction, and monitor team performance all in one place. This leads to faster responses, happier customers, and a more efficient team. Start your free trial today and experience the power of data-driven engagement.
FAQs
Which customer engagement metrics should my business track?
Start with response time, resolution time, CSAT, NPS, CES, engagement rate, repeat interaction rate, conversation volume trends, self-service engagement, channel performance, team performance, retention rate, and CLV. These cover efficiency, satisfaction, loyalty, and business outcomes.
How do I know if our metrics are good or bad?
Benchmarks vary by industry and channel. The key is to track trends over time. Look for improvements or declines, and compare similar periods. Focus on your own growth and customer experience rather than generic numbers.
What if my team feels pressured by metrics?
Metrics are not about blaming anyone. They help you coach your team, recognise high performers, balance workloads, and identify areas for support. Framing metrics as tools for improvement keeps your team motivated.
Can tracking metrics really reduce churn?
Yes. Metrics like CES, repeat interaction rate, and retention rate show where customers struggle or disengage. Spotting these early allows you to act before a customer leaves, improving loyalty and retention.
Do we need fancy tools to track engagement metrics?
You don’t need complicated systems, but unified tools make a huge difference. Platforms like Trengo consolidate all channels, track metrics automatically, and provide analytics so your team spends less time searching and more time improving customer experiences.
How often should we review customer engagement metrics?
Review them regularly, weekly or monthly for most metrics, and in real time for urgent channels like live chat or social messaging. Frequent reviews help you spot trends, respond to issues quickly, and make data-driven decisions.
What if our metrics look good but customers are still unhappy?
Metrics give insight, but they don’t replace listening. Combine data with direct customer feedback to understand the “why” behind numbers. CSAT surveys, CES, and NPS are essential for capturing feelings alongside behaviour.
How can we improve metrics without overworking our team?
Use automation, AI-assisted replies, and self-service options to reduce repetitive tasks. Measure performance and focus on high-impact improvements. Better tools and smarter workflows can lift metrics while keeping your team efficient.
Are these metrics relevant for small businesses or only large enterprises?
Every business benefits. Even small teams can track response times, satisfaction, and engagement. With the right platform, small businesses can deliver customer-focused service at the same level as larger competitors.